Server Monitor
The server monitoring feature connects to remote Linux servers via SSH to collect and display real-time system metrics, helping operators quickly assess server health.
Note: Server monitoring only supports Linux remote servers, as it relies on the
/procfilesystem and Linux-specific commands. SSH credentials (password or key) are required.
Opening the Monitor
Once an SSH connection is established, the monitoring panel can be opened from the following entry points:
| Entry Point | Action |
|---|---|
| Tab Context Menu | Right-click an SSH terminal tab → Server Monitor |
| Panel Menu | Click the ... button on the panel header → Open Server Monitor |
| Sidebar Context Menu | Right-click an SSH connection → Open Server Monitor |
| Monitor Sidebar | The "Monitor" tab in the left sidebar follows the current active SSH session and shows CPU / memory / network. Click Open Full Monitor to enter the full monitoring page |
The server monitor opens as an independent tab alongside terminal, file transfer, and other tabs. It supports drag-to-reorder.
Interface Overview
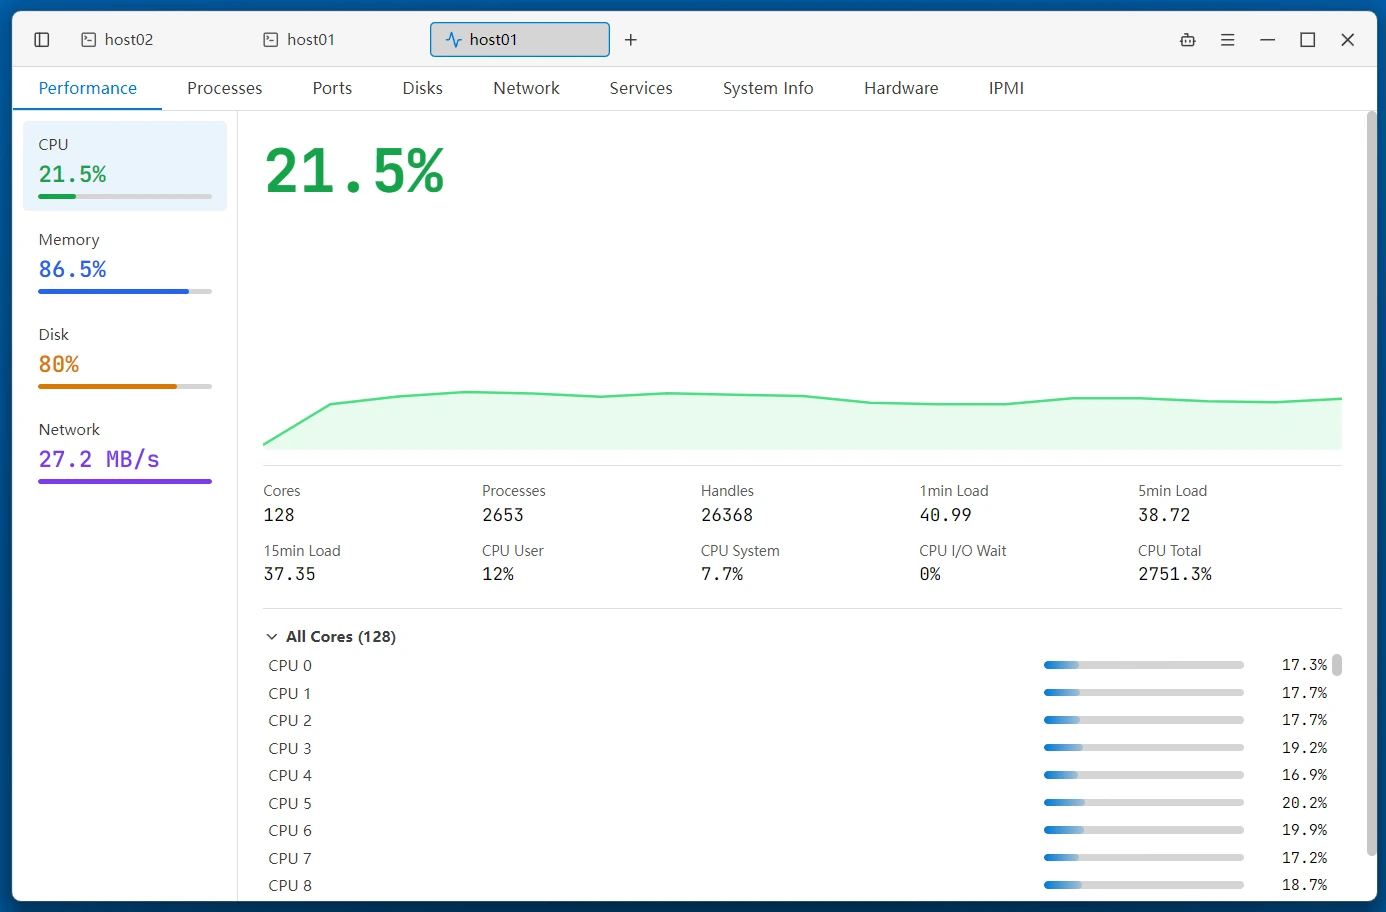
The monitoring panel is organized into nine tabs — Performance, Processes, Ports, Disks, Network, Services, System Info, Hardware, IPMI — freely switchable via the top tab bar.
Performance
Displays four core metrics — CPU, Memory, Disk, and Network — in real time, refreshing every second, with 60-point line charts showing the last 1 minute of history. Below the CPU / Network / Disk sections are collapsible All Cores / All Network Cards / All Disks detail lists, expandable per core, per network card, and per mount point.
CPU
- Total usage percentage with line chart
- Core count
- Total process count and file handle count
- 1-minute, 5-minute, and 15-minute load averages
Memory
- Total, used, available, and usage percentage
- Cached and buffers usage
Disk
- Root filesystem (
/) total, used, and usage percentage
Network
- Receive and transmit rates in bytes per second, calculated from the delta between consecutive samples
Processes
Lists the top 30 processes by CPU usage, refreshing every second.
| Feature | Description |
|---|---|
| Sorting | Sorted by CPU descending by default |
| Search | Filter by process name, username, or PID |
| Pause | Click the pause button to stop refresh; click again to resume |
| Send Signal | The Send Signal button on the right of each row, or open the detail drawer by clicking the row and send from the bottom |
| Process Detail | Click any process row to open a detail drawer from the right |
Process Detail
Clicking a process opens a slide-in drawer with the following information:
- Basic Info — PID, PPID, name, state, thread count, executable path, working directory, full command line, start time
- File Descriptors — Total count with a breakdown by category (files, sockets, pipes, anonymous, devices)
- Virtual Memory — VmRSS, VmSize, VmPeak, VmData, VmStk, VmExe, VmLib
- CPU & Context Switches — CPU ticks, voluntary/involuntary context switch counts
- I/O Statistics — Read/write character and byte counts
Sending Signals
At the bottom of the process detail drawer, you can choose a signal type and send it to the process:
| Signal | Number | Description |
|---|---|---|
| TERM | 15 | Graceful termination (default) |
| KILL | 9 | Force kill |
| HUP | 1 | Hangup, commonly used to reload configuration |
| INT | 2 | Interrupt, equivalent to Ctrl+C |
A confirmation dialog appears before sending. Force kill (KILL) includes an additional warning.
Ports
Manual refresh. Lists all listening TCP/UDP ports.
| Column | Description |
|---|---|
| Protocol | TCP / UDP |
| Local Address | Listening address and port |
| Process | Process PID and name |
Disks
Manual refresh. Displays all block devices in a tree structure.
| Column | Description |
|---|---|
| Name | Device name; sub-partitions are indented |
| Type | disk / part / rom |
| Size | Total device capacity |
| Mount Point | Mount path |
| Used / Usage | Used space and percentage |
| Media | HDD / SSD / ROM |
| Filesystem | ext4, xfs, etc. |
| UUID | Device UUID |
| Vendor / Model | Hardware information |
Network
Manual refresh. Lists all network interfaces.
| Column | Description |
|---|---|
| Name | Interface name (eth0, wlan0, etc.) |
| State | UP / DOWN |
| MAC | MAC address |
| Speed | Interface speed (Mbps) |
| Type | Physical / Bridge / Bond / Virtual / Loopback |
| Bond Master | Parent bond interface (if applicable) |
| IP Addresses | List of bound IP addresses |
Services
View and manage system services on systemd hosts:
- The list shows Unit / State / Startup / Description, with search and refresh support
- Each service can be started / stopped / restarted / enabled at boot / disabled at boot / have its logs viewed; dangerous actions require confirmation
- Logs support auto-scrolling; clicking a service row opens its details
System Info
Displays the server's static configuration information along with a live clock:
| Category | Content |
|---|---|
| System | User, uptime, operating system, version, kernel version, hostname, local IP |
| CPU | CPU model, core count, architecture, CPU frequency, total memory, total disk |
| Clock | Timezone, host clock (ticking in real time), clock skew (a positive value means the host clock is ahead of the local machine) |
Clock skew helps spot hosts whose NTP is unsynchronized or whose clocks have drifted, which is useful when troubleshooting certificate validation and log ordering issues.
Hardware
Displays hardware information in a tree table grouped by category: processors, memory, storage, network, display & audio, buses, and more. Columns are ID / Class / Vendor / Device / Driver / Serial / Capacity / Version, with search support.
IPMI
Collects the server's out-of-band management information via ipmitool, in three parts:
- Device Info — Product, manufacturer, serial number, part number
- Network — IPMI network configuration
- Sensors — Sensor / Value / Unit / Status / Source, with search support
A notice is shown when ipmitool is not installed on the host.
Related
- Remote Terminal — SSH connection configuration and usage
- File Transfer — SFTP file browser
- Sidebar — The monitor sidebar